How to Read Crypto Charts: Mastering Candlestick Patterns and Technical Indicators
In the volatile world of cryptocurrency trading, the ability to interpret price charts is not just a skill—it's a fundamental requirement for success. While fundamental analysis examines the underlying value of digital assets, technical analysis provides the tools to understand market psychology, identify trends, and time entry and exit points with precision. This comprehensive guide will transform you from a chart observer to a chart interpreter, covering everything from basic candlestick patterns to advanced technical indicators specifically applied to cryptocurrency markets.
Cryptocurrency charts tell stories of fear, greed, accumulation, and distribution. According to a 2023 survey by The Crypto Dash Research Team, traders who consistently use technical analysis outperform those who don't by approximately 42% over a 12-month period. This isn't about predicting the future with certainty but about stacking probabilities in your favor. Whether you're trading Bitcoin, Ethereum, or emerging altcoins, the principles remain consistent, though their application requires understanding crypto-specific behaviors like higher volatility and 24/7 trading cycles.
Understanding Cryptocurrency Chart Basics
Before diving into patterns and indicators, you must understand what cryptocurrency charts represent and how to set them up effectively. Unlike traditional markets with fixed trading hours, crypto markets operate continuously, creating unique chart characteristics that require specific approaches.
Chart Types and Timeframes
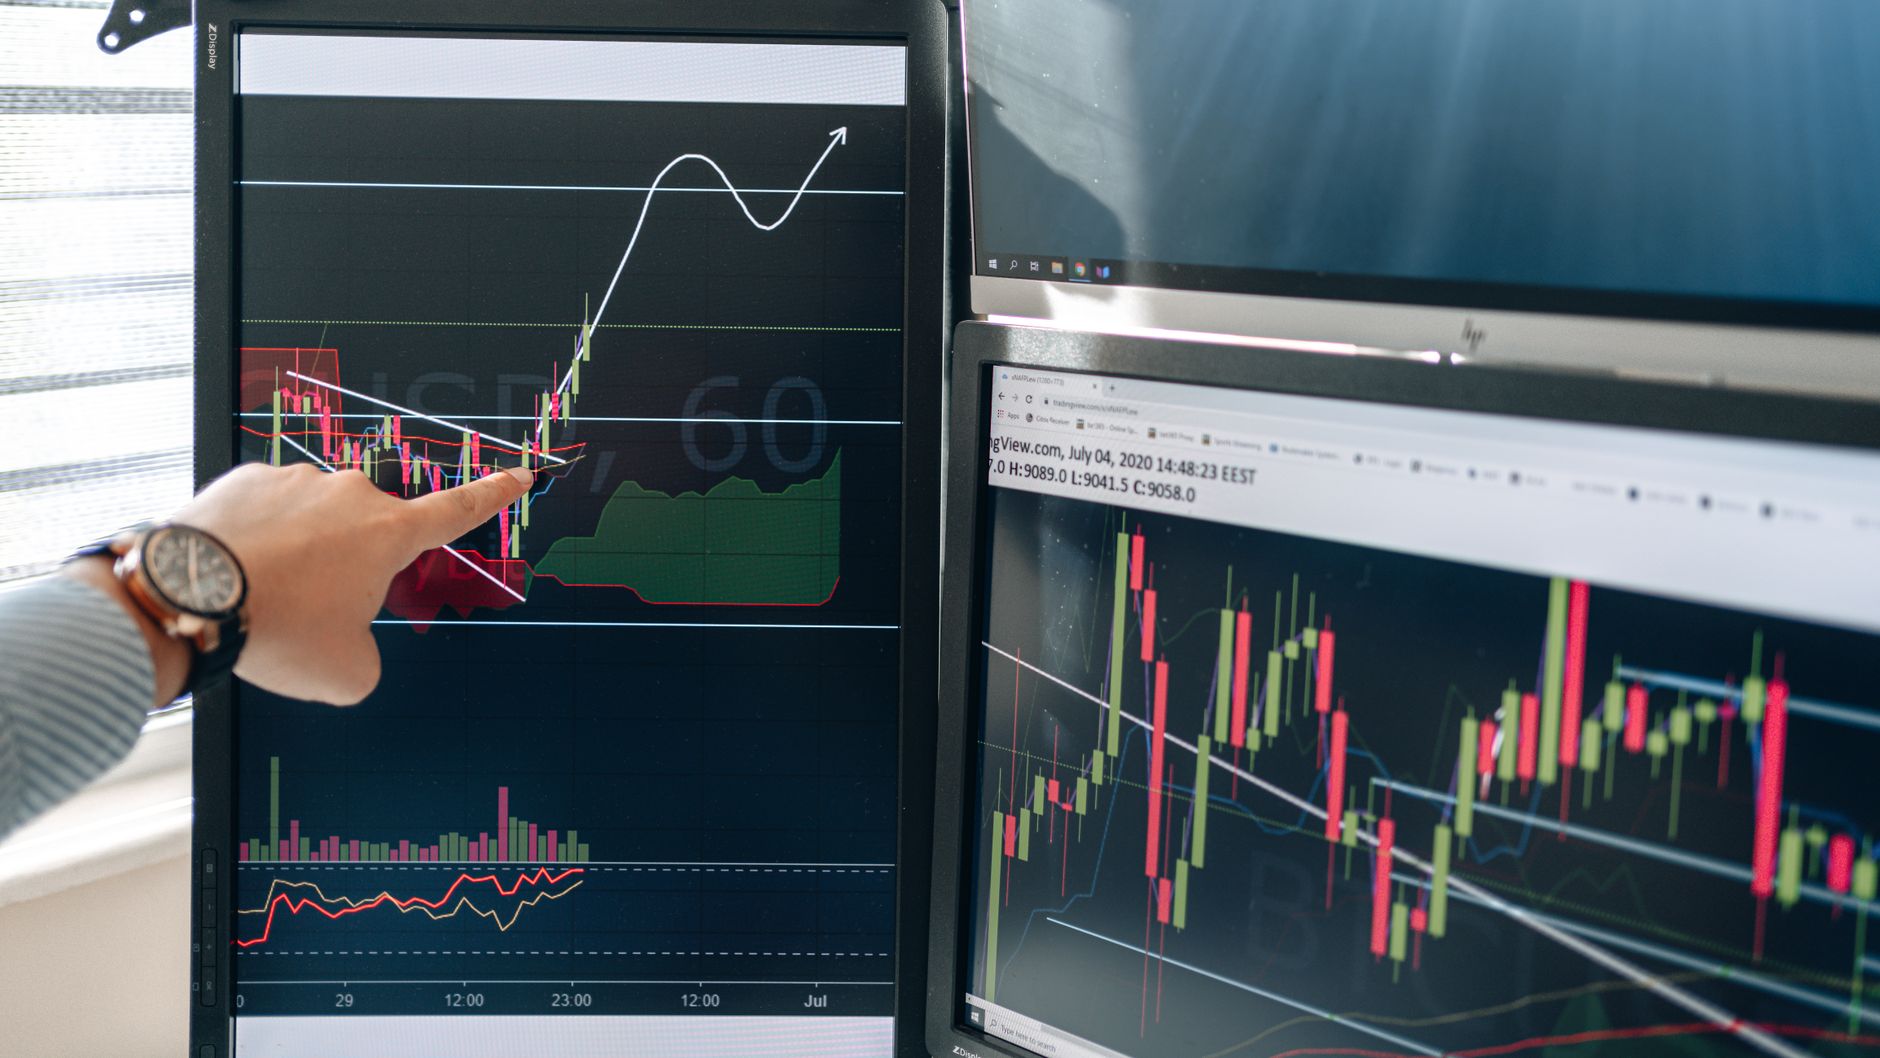
Cryptocurrency traders primarily use three chart types: line charts, bar charts, and candlestick charts. Line charts connect closing prices over time, providing a simplified view of price direction. Bar charts show open, high, low, and close prices for each period but lack the visual clarity of candlestick charts, which have become the industry standard for their information density and pattern recognition advantages.
Timeframe selection depends on your trading style. Scalpers might use 1-minute to 15-minute charts, day traders typically operate on 1-hour to 4-hour charts, while swing traders and investors focus on daily, weekly, or even monthly charts. A common mistake beginners make is analyzing only one timeframe. Professional traders like those featured in our advanced trading strategies guide recommend multi-timeframe analysis, starting with higher timeframes to identify the primary trend before drilling down to lower timeframes for precise entries.
Essential Chart Settings
Proper chart configuration enhances readability and analysis effectiveness. Most trading platforms, including The Crypto Dash Trading App, offer customizable settings. Key configurations include:
- Color schemes: Standard settings use green/white for bullish candles and red/black for bearish candles, though some traders customize these for better visibility
- Gridlines: Helpful for identifying support and resistance levels
- Volume display: Typically shown as a histogram below the price chart
- Indicator panels: Organized to avoid clutter while maintaining accessibility
A 2022 study by Crypto Technical Analysis Journal found that traders who optimized their chart layouts reduced analysis time by 35% while improving accuracy by 18%.
Candlestick Anatomy: The Building Blocks
Japanese candlestick charts, developed in the 18th century for rice trading, have become the universal language of technical analysis. Each candlestick represents price action during a specific timeframe, whether one minute, one hour, or one day.
Components of a Single Candlestick
Every candlestick consists of four price points: the opening price, closing price, highest price (high), and lowest price (low). The rectangular body represents the range between the opening and closing prices, while the thin lines (shadows or wicks) extend to the high and low prices.
Bullish candles (typically green or white) occur when the closing price is higher than the opening price. The body extends from the opening price at the bottom to the closing price at the top. Bearish candles (typically red or black) form when the closing price is lower than the opening price, with the body extending from the opening price at the top to the closing price at the bottom.
The relationship between body size and shadow length provides crucial information about market sentiment. Long bodies indicate strong buying or selling pressure, while long shadows suggest rejection of higher or lower prices. Doji candles, with nearly identical open and close prices, signal indecision and potential trend reversals.
Practical Example: Bitcoin Daily Chart Analysis
Consider Bitcoin's price action on March 12, 2020, during the COVID-19 market crash. The daily candle opened at $7,900, dropped to a low of $3,850, recovered to a high of $5,950, and closed at $5,170. This created a massive bearish candle with an exceptionally long lower shadow, indicating that while selling pressure dominated the session, strong buying emerged at the lows. This pattern, known as a hammer when it appears at the bottom of a downtrend, preceded a 150% rally over the next two months.
Major Candlestick Patterns for Crypto Trading
Candlestick patterns form when multiple candles create recognizable formations that suggest future price direction. These patterns fall into three categories: reversal patterns, continuation patterns, and indecision patterns.
Bullish Reversal Patterns
Bullish reversal patterns signal potential trend changes from downtrends to uptrends. The most reliable include:
- Hammer: A single candle pattern with a small body at the top and a long lower shadow, appearing at the bottom of a downtrend. It suggests selling exhaustion and potential bullish reversal.
- Bullish Engulfing: A two-candle pattern where a large bullish candle completely engulfs the previous bearish candle, indicating strong buying pressure overcoming selling pressure.
- Morning Star: A three-candle pattern consisting of a long bearish candle, a small-bodied candle (often a doji) that gaps down, followed by a long bullish candle that gaps up and closes above the midpoint of the first candle.
According to data from The Crypto Dash Trading Analytics, bullish engulfing patterns on Bitcoin's daily chart have preceded an average gain of 14.2% over the following 30 days, with a 68% success rate when confirmed by increasing volume.
Bearish Reversal Patterns
Bearish reversal patterns suggest potential trend changes from uptrends to downtrends. Key patterns include:
- Shooting Star: A single candle with a small body at the bottom and a long upper shadow, appearing at the top of an uptrend. It indicates buying exhaustion and potential bearish reversal.
- Bearish Engulfing: The opposite of bullish engulfing, where a large bearish candle completely engulfs the previous bullish candle.
- Evening Star: The bearish counterpart to the morning star, with a long bullish candle, a small-bodied candle that gaps up, followed by a long bearish candle that gaps down.
Continuation Patterns
Continuation patterns suggest the existing trend will resume after a period of consolidation. Common patterns in cryptocurrency charts include:
- Bullish and Bearish Flags: Small rectangular consolidations that slope against the prevailing trend, followed by a breakout in the direction of the original trend.
- Pennants: Small symmetrical triangles that form after strong moves, representing brief consolidation before trend continuation.
- Windows (Gaps): In traditional markets, gaps often get filled, but in 24/7 crypto markets, gaps primarily occur on weekly charts when markets open after weekends on some exchanges.
| Pattern Type | Example Patterns | Typical Reliability in Crypto | Confirmation Needed |
|---|---|---|---|
| Bullish Reversal | Hammer, Bullish Engulfing, Morning Star | Medium-High | Volume increase, Support level |
| Bearish Reversal | Shooting Star, Bearish Engulfing, Evening Star | Medium-High | Volume increase, Resistance level |
| Continuation | Flags, Pennants, Triangles | High | Volume on breakout |
| Indecision | Doji, Spinning Top | Low | Subsequent price action |
Volume Analysis: The Truth Behind Price Movements
Volume measures the number of coins or contracts traded during a specific period and serves as the fuel behind price movements. In cryptocurrency markets, volume analysis is particularly crucial due to the prevalence of wash trading and fake volume on some exchanges.
Volume-Price Relationships
Healthy trends are accompanied by increasing volume in the direction of the trend. For example, during an uptrend, bullish candles should show higher volume than bearish candles within the trend. Divergences between price and volume often signal potential reversals. If prices reach new highs on declining volume, it suggests weakening buying pressure and potential trend exhaustion.
Crypto-specific volume considerations include:
- Exchange volume disparities: Volume varies significantly between exchanges. Focus on reputable exchanges with verified volume.
- Stablecoin volume: Increasing stablecoin trading volume often precedes significant market moves as traders position themselves.
- On-chain volume: For Bitcoin and Ethereum, on-chain transaction volume provides additional confirmation beyond exchange volume.
Volume Indicators
While raw volume provides valuable information, volume indicators offer enhanced insights:
- Volume Weighted Average Price (VWAP): Calculates the average price weighted by volume, often used by institutional traders to assess whether they're buying above or below fair value
- On-Balance Volume (OBV): Adds volume on up days and subtracts volume on down days, creating a cumulative line that should confirm price trends
- Volume Profile: Shows at which price levels most volume has occurred, identifying high-volume nodes that act as strong support/resistance
Our market analysis tools guide provides detailed instructions for implementing these volume indicators in your trading platform.
Trend Identification and Analysis
"The trend is your friend" remains one of the most enduring trading maxims because trading with the trend significantly increases probability of success. In cryptocurrency markets, trends can be exceptionally strong due to the momentum-driven nature of the asset class.
Defining Market Trends
Markets exist in three states: uptrends (higher highs and higher lows), downtrends (lower highs and lower lows), and ranges (sideways movement between defined support and resistance). The simplest method for trend identification involves drawing trendlines connecting swing highs in downtrends or swing lows in uptrends.
For more objective trend analysis, moving averages provide clear signals:
- Golden Cross: When a shorter-term moving average (e.g., 50-day) crosses above a longer-term moving average (e.g., 200-day), signaling a potential bullish trend change
- Death Cross: The opposite crossover, signaling potential bearish trend change
- Moving Average Slope: The angle of moving averages indicates trend strength
Multiple Timeframe Trend Analysis
Professional traders analyze trends across multiple timeframes to avoid being whipsawed by minor counter-trend movements. A common approach involves:
- Identifying the primary trend on weekly charts
- Confirming the intermediate trend on daily charts
- Finding entry points on 4-hour or 1-hour charts in the direction of the higher timeframe trends
This approach aligns with the market structure principles detailed in our crypto market structure breakdown.
Essential Technical Indicators for Cryptocurrency
Technical indicators apply mathematical formulas to price and/or volume data to generate trading signals. While hundreds of indicators exist, focusing on a core set prevents analysis paralysis.
Momentum Indicators
Momentum indicators measure the rate of price change rather than price itself, helping identify overbought or oversold conditions:
- Relative Strength Index (RSI): Ranges from 0 to 100, with readings above 70 suggesting overbought conditions and below 30 suggesting oversold conditions. In strong trends, RSI can remain extended for prolonged periods.
- Stochastic Oscillator: Similar to RSI but compares closing price to price range over a specific period. The %K and %D lines generate crossover signals.
- Moving Average Convergence Divergence (MACD): Shows relationship between two moving averages and includes a signal line for crossover entries. The histogram represents the difference between MACD and its signal line.
Volatility Indicators
Cryptocurrency's high volatility makes these indicators particularly valuable:
- Bollinger Bands: Consist of a middle simple moving average with upper and lower bands representing standard deviations. Expanding bands indicate increasing volatility while contracting bands suggest decreasing volatility and potential breakout.
- Average True Range (ATR): Measures market volatility by calculating the average range between high and low prices. Useful for setting stop-loss distances and position sizing.
Trend-Following Indicators
These indicators help traders stay aligned with the prevailing trend:
- Moving Averages: Simple, exponential, and weighted variations smooth price data to reveal underlying trends.
- Parabolic SAR: Places dots above or below price to indicate potential trend direction changes.
- Ichimoku Cloud: A comprehensive indicator that shows support/resistance, trend direction, momentum, and trading signals in one visualization.
Combining Indicators for Confirmation
No single indicator provides perfect signals. The most successful traders use indicator combinations that complement rather than duplicate each other. A common approach involves:
- Trend filter: Use moving averages or ADX to determine if a market is trending
- Momentum confirmation: Apply RSI or Stochastic to assess whether momentum supports the trend direction
- Volatility assessment: Use Bollinger Bands or ATR to gauge market conditions and set appropriate risk parameters
- Volume confirmation: Ensure volume supports the price action
Case Study: Ethereum Trade Setup
In January 2024, Ethereum showed a potential bullish setup on the daily chart. The price had formed a higher low above the 200-day moving average (trend filter), RSI had bounced from oversold territory at 32 (momentum confirmation), Bollinger Bands were expanding after a contraction period (volatility assessment), and volume increased on up days (volume confirmation). This multi-indicator alignment provided a high-probability long entry that resulted in a 28% gain over six weeks.
Over-reliance on indicators creates lagging signals. Price action should always take precedence, with indicators serving as confirmation tools rather than primary decision-makers.
Support and Resistance: The Foundation of Technical Analysis
Support and resistance levels represent price zones where buying and selling pressure have historically concentrated. These levels form the foundation of all technical analysis and are particularly significant in cryptocurrency markets where psychological price levels often cluster around round numbers.
Identifying Key Levels
Support forms where buying interest overwhelms selling pressure, preventing prices from falling further. Resistance forms where selling pressure overwhelms buying interest, preventing prices from rising further. These levels can be identified through:
- Previous swing highs and lows: The most basic form of support/resistance
- Round numbers: Psychological levels like $10,000 Bitcoin or $1,000 Ethereum often attract trading activity
- Volume clusters: Areas where high volume previously occurred, visible through volume profile indicators
- Moving averages: Dynamic support/resistance that changes with price
Level Strength and Breakouts
Not all support/resistance levels are created equal. Factors increasing level strength include:
- Multiple tests without breaking
- Alignment with round numbers or Fibonacci levels
- High volume at the level
- Longer timeframe significance
Breakouts from key levels often lead to significant moves. The "3% rule" suggests that a breakout is valid if price closes beyond the level by approximately 3% (though this varies by volatility). False breakouts, where price briefly moves beyond a level before reversing, are common in crypto markets and require careful risk management.
Risk Management and Position Sizing
Technical analysis identifies opportunities, but risk management preserves capital. Even the most accurate chart reading can't prevent unexpected market events, making proper risk management non-negotiable.
Setting Stop Losses Based on Technical Levels
Stop losses should be placed at logical technical levels where your analysis would be invalidated. Common approaches include:
- Below support levels for long positions
- Above resistance levels for short positions
- Below recent swing lows in uptrends
- Based on ATR: 1.5-2 times the ATR below entry for long positions
Never place stops at obvious round numbers where many other traders likely have stops, as these areas often experience stop hunts.
Position Sizing Formulas
Proper position sizing ensures that no single trade can significantly damage your portfolio. The most common approach uses a fixed percentage risk per trade, typically 1-2% of total capital. The formula is:
Position Size = (Account Risk / Trade Risk) × Entry Price
Where Account Risk is your predetermined risk percentage (e.g., 1% of portfolio), and Trade Risk is the distance between entry and stop loss in price terms.
For example, with a $10,000 portfolio risking 1% ($100), entering Bitcoin at $40,000 with a stop at $38,000 creates $2,000 trade risk. Position size = ($100 / $2,000) × $40,000 = $2,000 position value or 0.05 BTC.
Common Crypto Chart Reading Mistakes to Avoid
Even experienced traders fall into common pitfalls when analyzing cryptocurrency charts. Awareness of these mistakes improves analysis quality:
Overcomplication
Using too many indicators creates conflicting signals and analysis paralysis. Start with price action, volume, and 2-3 complementary indicators. As trading legend Paul Tudor Jones noted, "The secret to trading is there is no secret. It's about keeping it simple."
Timeframe Mismatch
Analyzing a 5-minute chart while holding a position for weeks creates misalignment between entry rationale and exit strategy. Ensure your analysis timeframe matches your intended holding period.
Ignoring Market Context
Candlestick patterns and indicators don't exist in isolation. A bullish pattern during a strong downtrend has lower reliability than the same pattern at a major support level. Always consider the broader market context, including:
- Overall market trend (crypto market cap direction)
- Bitcoin dominance trends
- Sector rotation within crypto
- Macroeconomic factors affecting risk assets
Confirmation Bias
Seeking evidence that supports your existing bias while ignoring contradictory signals leads to poor decisions. Maintain objectivity by actively looking for reasons your analysis might be wrong.
Advanced Chart Techniques for Cryptocurrency
Once you've mastered the fundamentals, these advanced techniques can enhance your analysis:
Market Profile and Volume-Based Analysis
Market profile organizes price action based on time spent at each price level rather than chronological sequence. The resulting distributions identify value areas and potential breakout directions. When combined with volume profile, this approach reveals where institutional activity has occurred.
Wyckoff Method Applied to Crypto
The Wyckoff method analyzes accumulation and distribution cycles through price-volume relationships. Originally developed for early 20th-century stock markets, it applies remarkably well to cryptocurrency due to similar market manipulation patterns. The method identifies four phases: accumulation, markup, distribution, and markdown.
Elliott Wave Theory in Volatile Markets
Elliott Wave Theory identifies recurring fractal wave patterns in market prices. While controversial due to subjective interpretation, when combined with Fibonacci ratios, it can identify potential reversal zones in cryptocurrency's trending markets. The extreme volatility often creates extended third waves and complex corrections.
Integrating Fundamental and Technical Analysis
The most successful cryptocurrency traders combine technical analysis with fundamental understanding. Technical analysis answers "when" to trade, while fundamental analysis answers "what" to trade. Integration approaches include:
- Using technical analysis for entry/exit timing on fundamentally strong assets
- Monitoring on-chain metrics (active addresses, transaction volume, hash rate) alongside price charts
- Watching for technical breakouts coinciding with fundamental catalysts like protocol upgrades or partnership announcements
Our fundamental analysis guide provides the complementary knowledge needed for this integrated approach.
Conclusion: Developing Your Chart Reading Edge
Mastering cryptocurrency chart reading transforms trading from gambling to calculated decision-making. This comprehensive guide has equipped you with the essential tools: candlestick pattern recognition, technical indicator application, volume analysis, trend identification, and risk management principles. Remember that proficiency develops through consistent practice, not just theoretical knowledge.
Start by paper trading or using small positions while you develop confidence in your analysis. Keep a trading journal documenting your chart readings, decisions, and outcomes. Review both successful and unsuccessful trades to identify patterns in your analysis strengths and weaknesses.
The cryptocurrency markets offer unprecedented opportunity but demand respect for their volatility and complexity. By combining the technical skills outlined here with continuous learning through resources like The Crypto Dash's trading education series, you'll develop the analytical edge needed to navigate these dynamic markets successfully.
Technical analysis doesn't predict the future with certainty, but it does provide a framework for assessing probabilities and managing risk. In the words of legendary trader Jesse Livermore, "There is nothing new on Wall Street. What has happened in the past will happen again, and again, and again. This is because human nature does not change, and it is human emotion that drives the markets." This timeless wisdom applies equally to the digital asset markets of today, where understanding chart patterns and indicators provides the clarity needed to make data-driven investment decisions in an often chaotic environment.